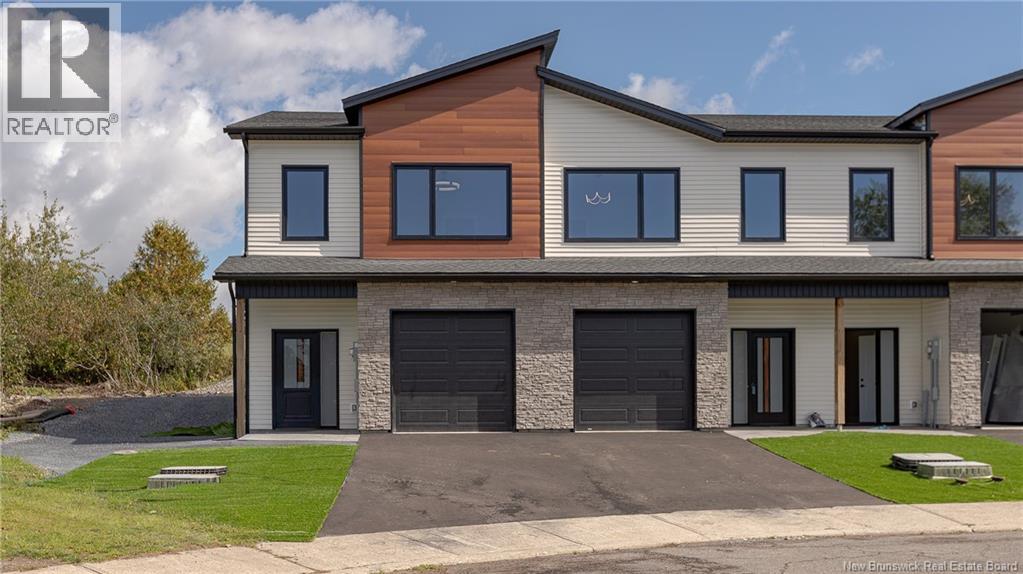
$439,000
48 Oakhill Crescent
Saint John, New Brunswick
3 bed · 3 bath · 1,551 square feet
Single Family
Listed by RE/MAX Professionals
For the neighbours of Saint John East

I’m Grace Chappel, and I sell homes with The Ellis Team at REAL Brokerage. I love this side of the city, and Saint John East is the neighbourhood I keep this page for.
This page is for the people on these streets: what is for sale, what has sold and what it means for your home, kept current every hour.
Saint John East is the east side from Champlain Heights to Latimore Lake Road, between Loch Lomond Road and Grandview Avenue, with the streets just across Loch Lomond Road, Michael Crescent, Red Head and two mobile home parks: 1,775 homes and 378 mobile homes on 112 streets, counting houses, townhouses and garden homes as homes.

Homes and mobile homes are shown apart, because they sell at such different prices.
Inside the line today
Every brokerage's home inside the line, with who listed it. Across Saint John there are 111, at a median asking price of $369,900.
$439,000
48 Oakhill Crescent
Saint John, New Brunswick
3 bed · 3 bath · 1,551 square feet
Single Family
Listed by RE/MAX Professionals
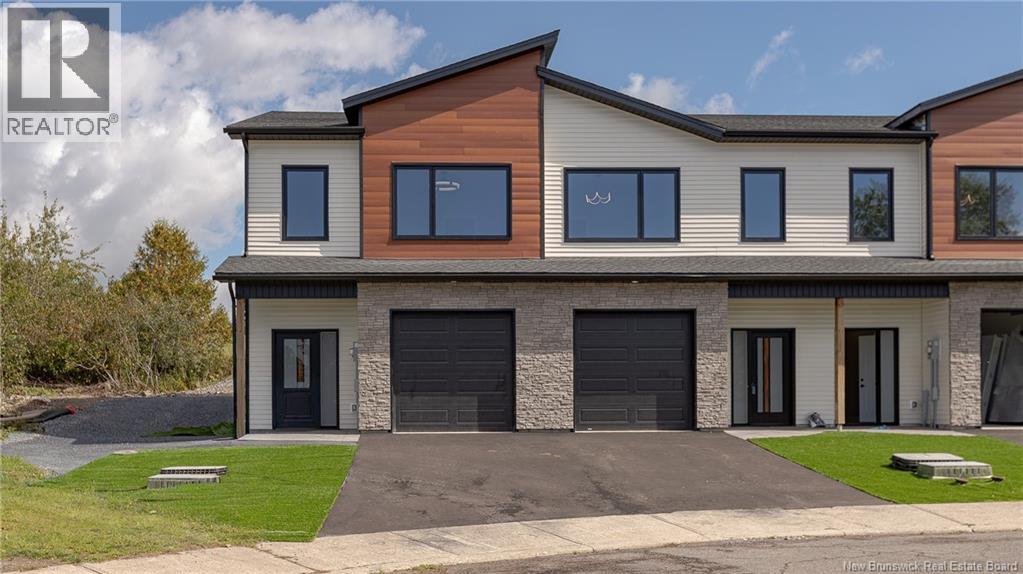
$449,000
50 Oakhill Crescent
Saint John, New Brunswick
3 bed · 3 bath · 1,551 square feet
Single Family
Listed by RE/MAX Professionals
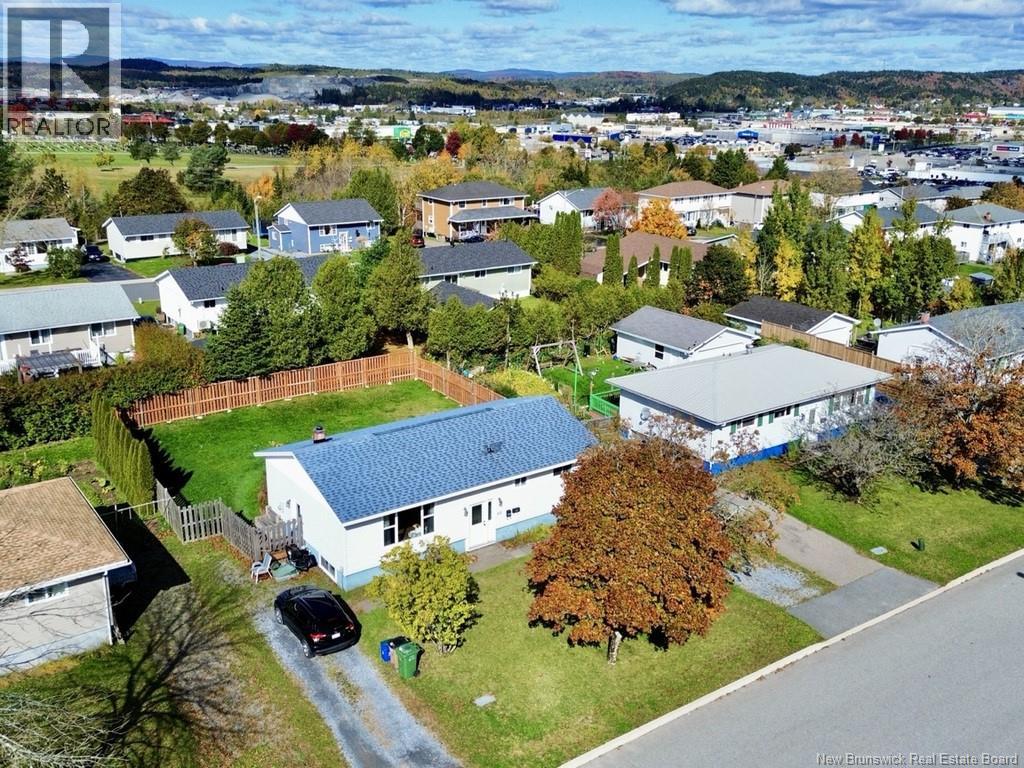
$299,000
611 Bonita Avenue
Saint John, New Brunswick
5 bed · 2 bath · 1,885 square feet
Single Family
Listed by RE/MAX Professionals
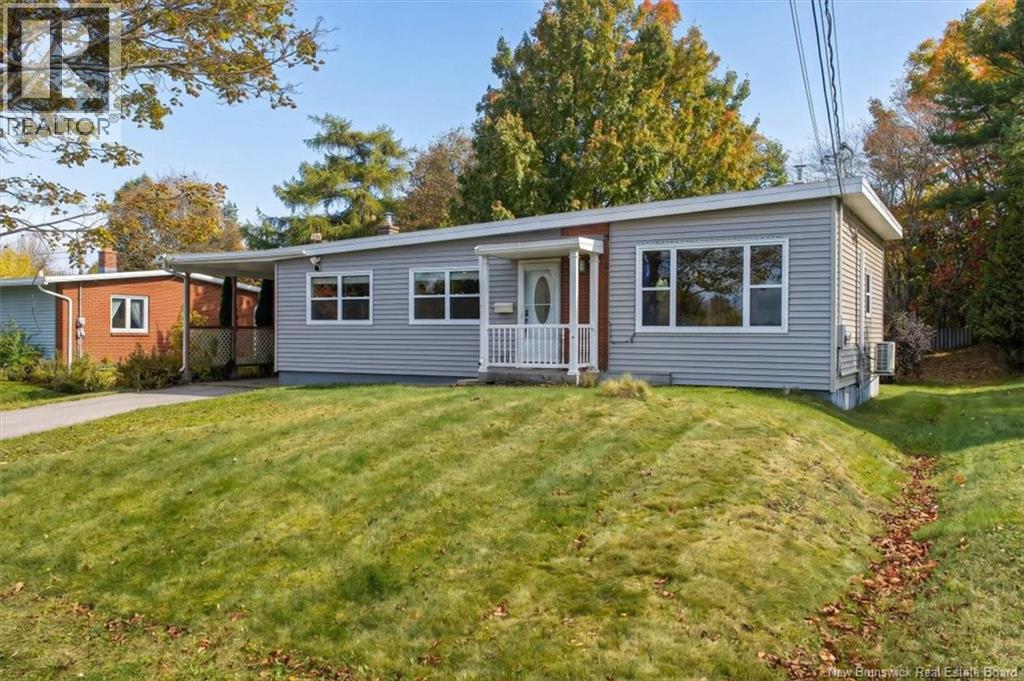
$299,900
26 Muriel Avenue
Saint John, New Brunswick
3 bed · 2 bath · 1,899 square feet
Single Family
Listed by Keller Williams Capital Realty
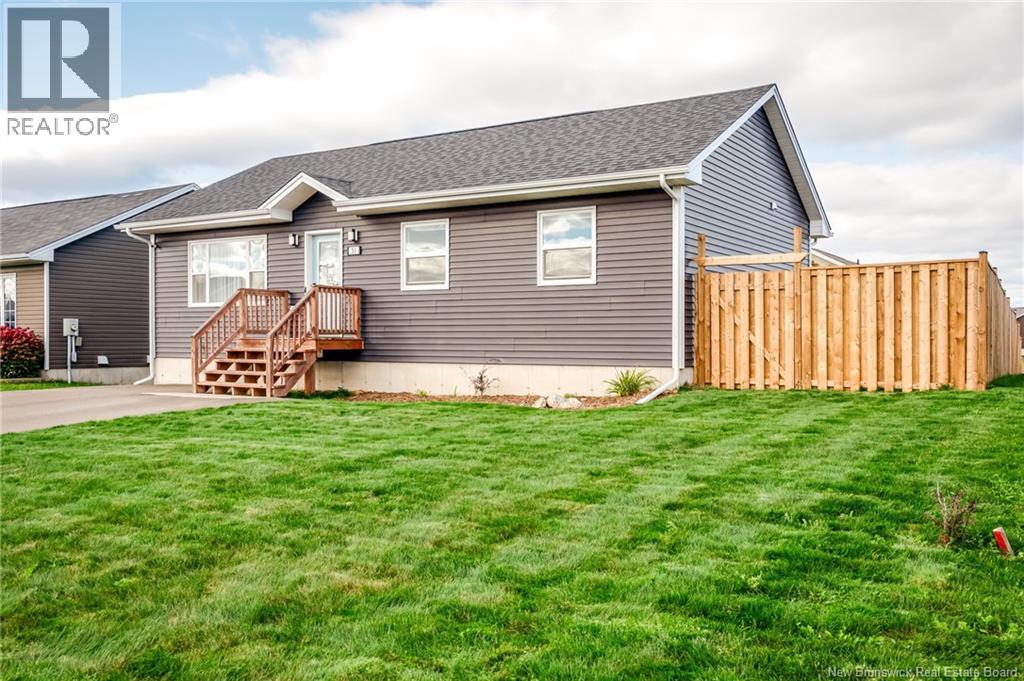
$419,900
31 Kappa Avenue
Saint John, New Brunswick
4 bed · 3 bath · 1,956 square feet
Single Family
Listed by Royal LePage Atlantic
Inside the line today
Every brokerage's mobile home inside the line, with who listed it. Across Saint John there are 9, at a median asking price of $169,500.
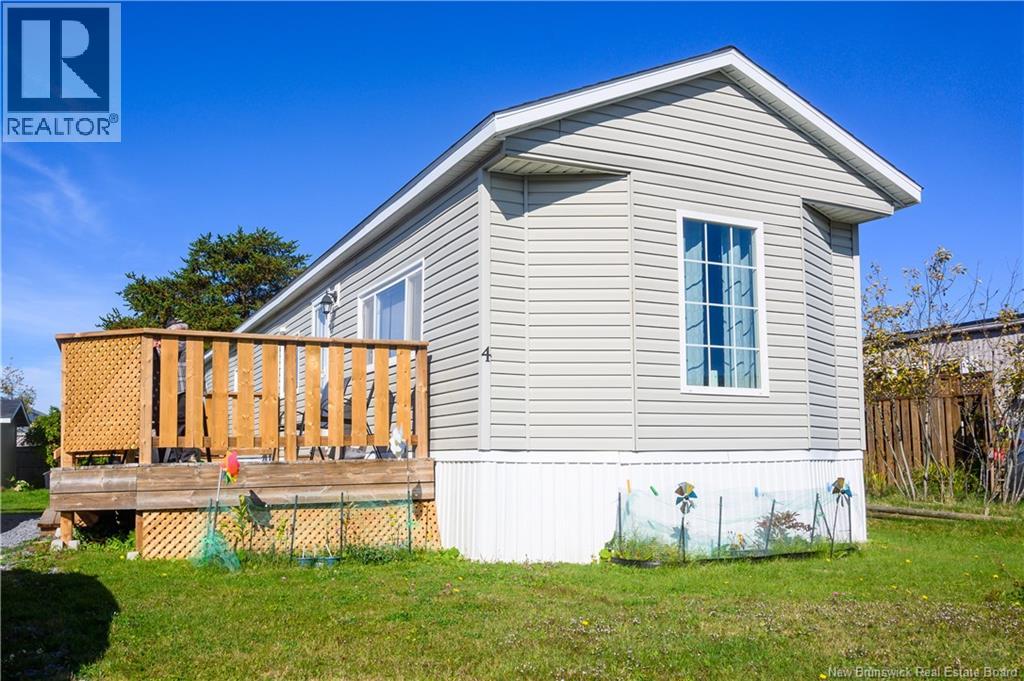
$119,900
4 Robin Court
Saint John, New Brunswick
2 bed · 1 bath · 840 square feet
Single Family
Listed by Royal LePage Atlantic
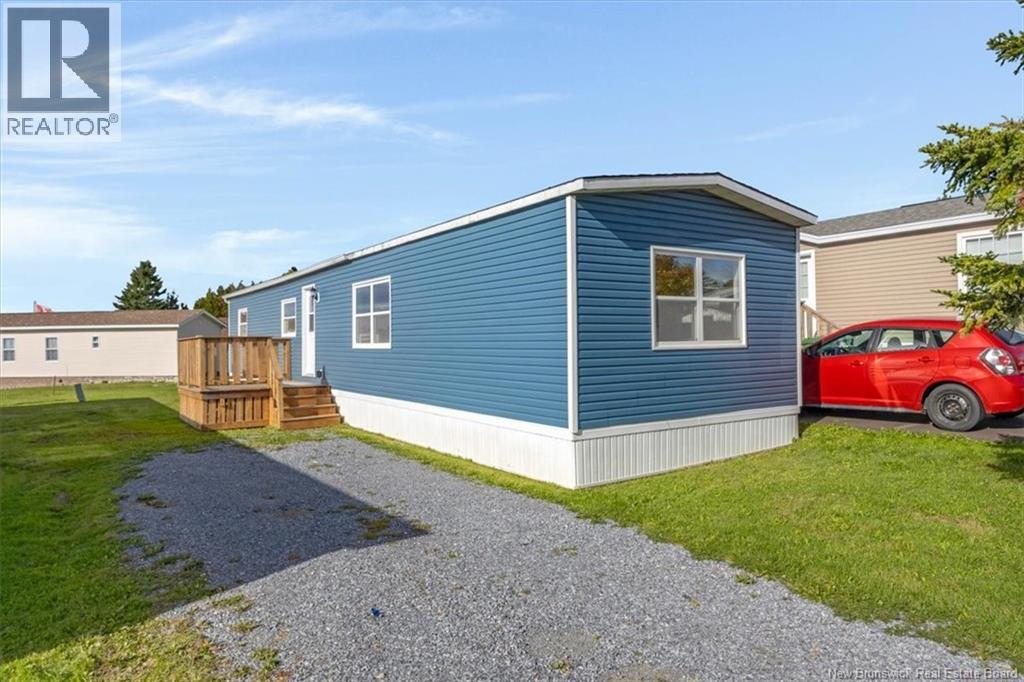
$179,900
11 Nova Drive
Saint John, New Brunswick
2 bed · 1 bath · 837 square feet
Single Family
Listed by EXIT Realty Specialists
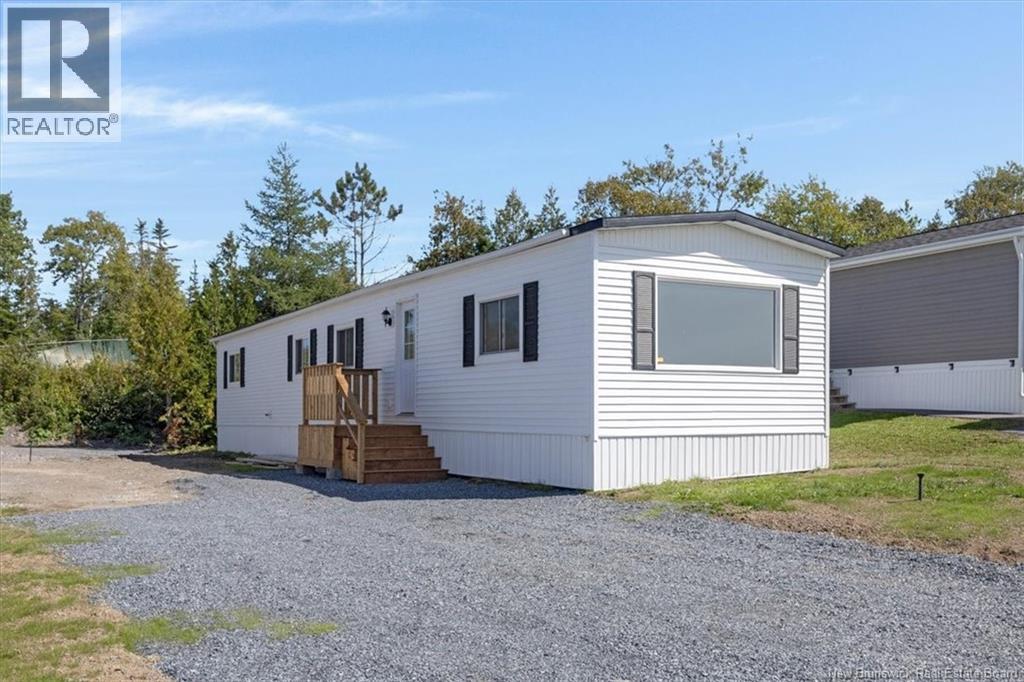
$159,900
41 Susan Drive
Saint John, New Brunswick
3 bed · 1 bath · 952 square feet
Single Family
Listed by EXIT Realty Specialists
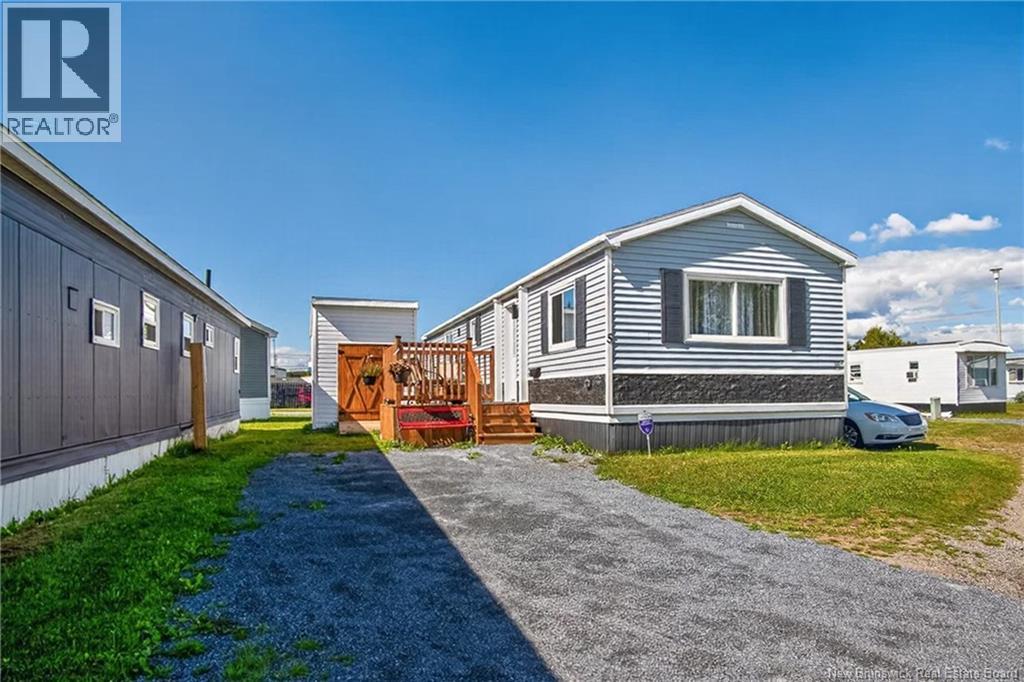
$169,500
5 Dove Street
Saint John, New Brunswick
2 bed · 1 bath · 728 square feet
Single Family
Listed by Real Broker
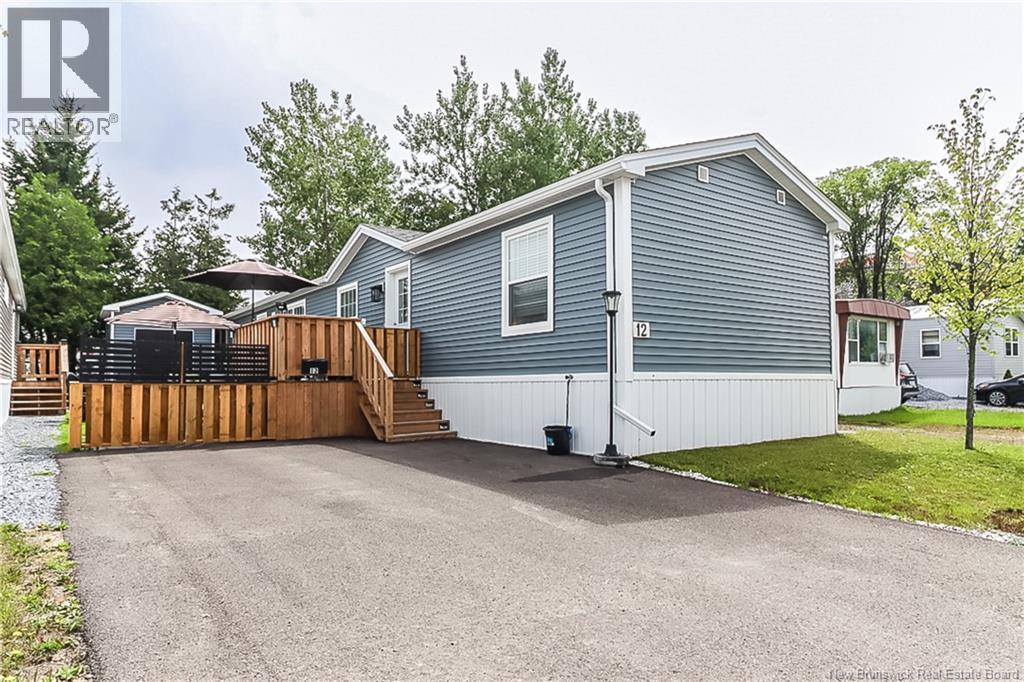
$260,000
12 Gull Street
Saint John, New Brunswick
3 bed · 2 bath · 1,152 square feet
Single Family
Listed by eXp Realty
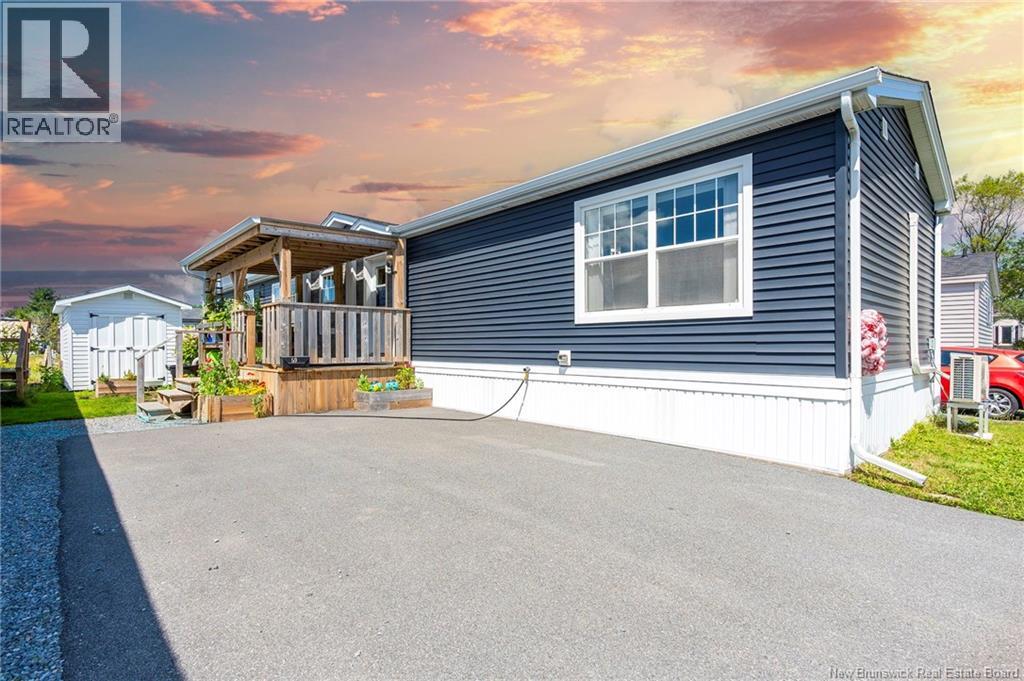
$228,500
59 Quail Court
Saint John, New Brunswick
3 bed · 2 bath · 1,120 square feet
Single Family
Listed by Royal LePage Atlantic
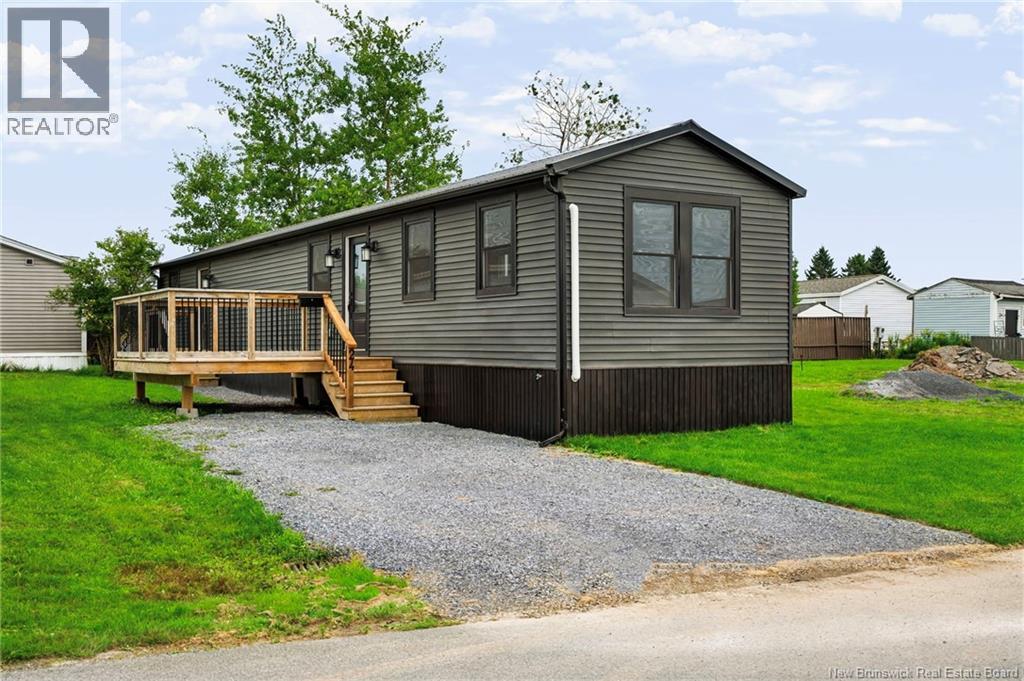
$189,900
24 Heron Street
Saint John, New Brunswick
2 bed · 1 bath · 896 square feet
Single Family
Listed by Royal LePage Atlantic
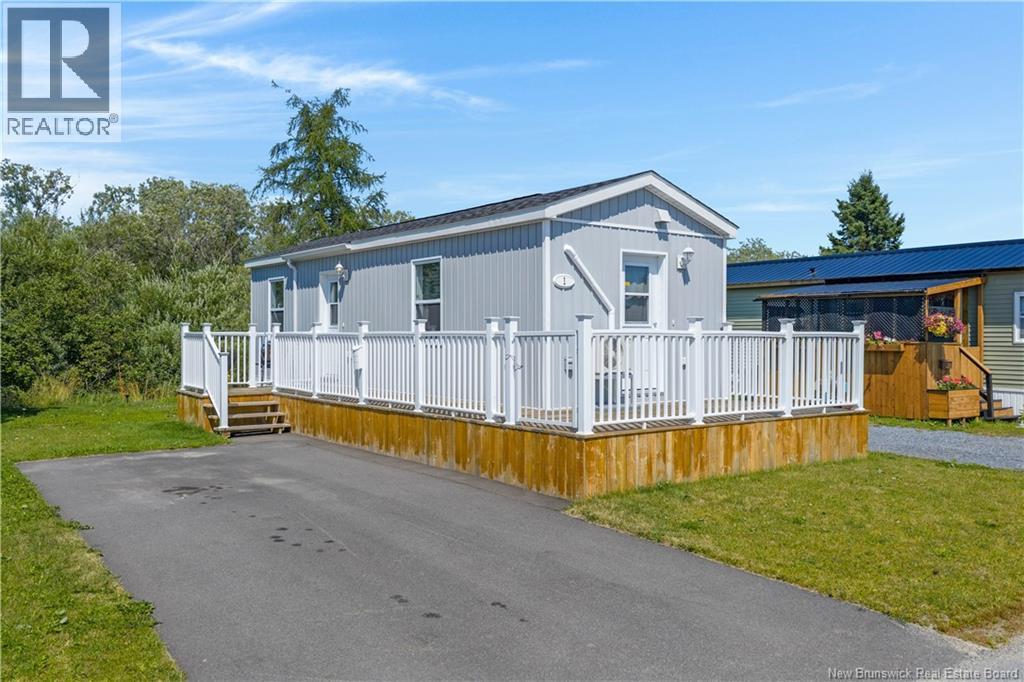
$110,000
1 Kingfisher Road
Saint John, New Brunswick
1 bed · 1 bath · 432 square feet
Single Family
Listed by EXIT Realty Specialists

$135,000
19 Gull Street
Saint John, New Brunswick
2 bed · 1 bath · 684 square feet
Single Family
Listed by RE/MAX Professionals
What our homes have been selling for
Houses, townhouses and garden homes. Mobile homes are counted apart: switch to them at the top of the page.
$324,000
Median sale price, the last twelve months
+19.6%
Median sale against assessed value
+8.5% to +33.3%
The middle half of them, against assessment
| Number on the map | Address | Month | Lot | Assessed | Sold for | vs assessed |
|---|---|---|---|---|---|---|
| 1 | 20 Macnaughton Dr | Sep 2026 | 0.2 ac | $308,600 | $256,666 | -16.8% |
| 2 | 146 Wyatt Cres | Sep 2026 | 0.1 ac | $295,900 | $288,000 | -2.7% |
| 3 | 140 Bon Accord Dr | Sep 2026 | 0.2 ac | $327,900 | $460,000 | +40.3% |
| 4 | 63 Boyaner Cres | Sep 2026 | 0.09 ac | $247,600 | $315,000 | +27.2% |
| 5 | 103 Boyaner Cres | Aug 2026 | 0.09 ac | $217,200 | $315,000 | +45.0% |
| 6 | 819 Highmeadow Pk | Aug 2026 | 0.02 ac | $181,700 | $220,000 | +21.1% |
| 7 | 47 Creighton Ave | Aug 2026 | 0.2 ac | $246,800 | $295,000 | +19.5% |
| 8 | 208 Boyaner Cres | Aug 2026 | 0.08 ac | $185,700 | $250,000 | +34.6% |
| 9 | 524 Highmeadow Dr | Aug 2026 | 0.02 ac | $172,400 | $237,000 | +37.5% |
| 10 | 13 Knox Crt | Jul 2026 | 0.3 ac | $237,400 | $329,900 | +39.0% |
| 11 | 17 Dorothea Dr | Jul 2026 | 0.2 ac | $244,100 | $270,000 | +10.6% |
| 12 | 22 Knox Crt | Jul 2026 | 0.2 ac | $260,800 | $270,000 | +3.5% |
| 13 | 547 Bonita Ave | Jul 2026 | 0.07 ac | $264,300 | $310,000 | +17.3% |
| 14 | 71 Champlain Dr | Jul 2026 | 0.2 ac | $273,400 | $327,000 | +19.6% |
| 15 | 15 Old Lake Trail | Jul 2026 | 0.3 ac | $725,000 | $860,000 | +18.6% |
| 16 | 54 Bon Accord Dr | Jul 2026 | 0.1 ac | $250,200 | $329,000 | +31.5% |
| 17 | 54 Creighton Ave | Jul 2026 | 0.2 ac | $258,700 | $240,000 | -7.2% |
| 18 | 37 Creighton Ave | Jul 2026 | 0.2 ac | $201,300 | $275,000 | +36.6% |
| 19 | 225 Mark Dr | Jul 2026 | 0.1 ac | $235,400 | $275,000 | +16.8% |
| 20 | 406 Highmeadow Dr | Jul 2026 | 0.02 ac | $183,100 | $225,000 | +22.9% |
| 21 | 68 Sherwood Dr | Jul 2026 | 0.2 ac | $228,600 | $252,000 | +10.2% |
| 22 | 232 Mark Dr | Jul 2026 | 0.08 ac | $239,400 | $320,000 | +33.7% |
| 23 | 32 Knox Crt | Jun 2026 | 0.2 ac | $255,900 | $311,857 | +21.9% |
| 24 | 7 Myles Dr | Jun 2026 | 0.3 ac | $200,800 | $349,000 | +73.8% |
| 25 | 66 Creighton Ave | Jun 2026 | 0.2 ac | $361,700 | $401,000 | +10.9% |
| 26 | 81 Old Lake Trail | Jun 2026 | 0.1 ac | $443,200 | $565,217 | +27.5% |
| 27 | 34 Strathorne Ave | Jun 2026 | 0.2 ac | $395,600 | $464,000 | +17.3% |
| 28 | 14 Silver Cres | Jun 2026 | 0.2 ac | $238,000 | $260,000 | +9.2% |
| 29 | 1583 Loch Lomond Rd | Jun 2026 | 0.3 ac | $303,300 | $420,000 | +38.5% |
| 30 | 22 Colter St | Jun 2026 | 0.09 ac | $295,700 | $320,000 | +8.2% |
| 31 | 28 Macnaughton Dr | Jun 2026 | 0.1 ac | $326,800 | $455,000 | +39.2% |
| 32 | 8 Myles Dr | Jun 2026 | 0.4 ac | $277,000 | $360,000 | +30.0% |
| 33 | 31 Sigma St | May 2026 | 0.2 ac | $417,900 | $526,000 | +25.9% |
| 34 | 909 Grandview Ave | May 2026 | 0.2 ac | $253,000 | $333,333 | +31.8% |
| 35 | 2 Colter St | May 2026 | 0.2 ac | $307,000 | $338,000 | +10.1% |
| 36 | 8 Bernice Crt | May 2026 | 0.09 ac | $247,300 | $310,000 | +25.4% |
| 37 | 2 Sylvia Dr | May 2026 | 0.2 ac | $291,200 | $330,000 | +13.3% |
| 38 | 125 Josselyn Rd | May 2026 | 0.5 ac | $209,700 | $455,700 | +117.3% |
| 39 | 45 Sherwood Dr | May 2026 | 0.2 ac | $365,400 | $370,000 | +1.3% |
| 40 | 16 Sunnybrook Terr | Apr 2026 | 0.1 ac | $295,000 | $405,000 | +37.3% |
| 41 | 28 Colter St | Apr 2026 | 0.1 ac | $305,500 | $340,000 | +11.3% |
| 42 | 50 Creighton Ave | Apr 2026 | 0.3 ac | $318,500 | $381,000 | +19.6% |
| 43 | 10 Silver Cres | Apr 2026 | 0.2 ac | $265,000 | $323,000 | +21.9% |
| 44 | 124 Cindy Lee St | Apr 2026 | 0.07 ac | $226,900 | $304,000 | +34.0% |
| 45 | 904 Highmeadow Dr | Mar 2026 | 0.02 ac | $164,100 | $225,000 | +37.1% |
| 46 | 159 Bon Accord Dr | Mar 2026 | 0.1 ac | $365,700 | $460,000 | +25.8% |
| 47 | 15 Muriel Ave | Mar 2026 | 0.2 ac | $281,700 | $293,000 | +4.0% |
| 48 | 55 Old Lake Trail | Mar 2026 | 0.2 ac | $382,600 | $500,000 | +30.7% |
| 49 | 88 Champlain Dr | Mar 2026 | 0.2 ac | $253,900 | $352,500 | +38.8% |
| 50 | 24 Hollybrook Crt | Mar 2026 | 0.06 ac | $188,500 | $188,500 | +0.0% |
| 51 | 44 Wyatt Cres | Mar 2026 | 0.6 ac | $107,600 | $156,522 | +45.5% |
| 52 | 129 Boyaner Cres | Feb 2026 | 0.09 ac | $234,600 | $268,000 | +14.2% |
| 53 | 81 Dorothea Dr | Feb 2026 | 0.2 ac | $294,100 | $350,000 | +19.0% |
| 54 | 571 Michael Cres | Feb 2026 | 0.2 ac | $304,900 | $330,000 | +8.2% |
| 55 | 66 Sunnybrook Terr | Jan 2026 | 0.2 ac | $357,600 | $400,000 | +11.9% |
| 56 | 1807 Hickey Rd | Jan 2026 | 0.4 ac | $85,000 | $225,000 | +164.7% |
| 57 | 667 Bonita Ave | Jan 2026 | 0.3 ac | $328,700 | $460,000 | +39.9% |
| 58 | 2 Rosedale Cres | Jan 2026 | 0.2 ac | $242,100 | $320,000 | +32.2% |
| 59 | 1015 Loch Lomond Rd | Jan 2026 | 0.3 ac | $253,500 | $330,500 | +30.4% |
| 60 | 60 Dorothea Dr | Dec 2025 | 0.2 ac | $265,200 | $285,000 | +7.5% |
| 61 | 15 Roatan Way | Dec 2025 | 0.2 ac | $526,800 | $550,000 | +4.4% |
| 62 | 10 Miranda Way | Dec 2025 | 0.08 ac | $254,500 | $364,348 | +43.2% |
| 63 | 4 Bernice Ct | Dec 2025 | 0.1 ac | $249,000 | $286,000 | +14.9% |
| 64 | 514 Highmeadow Dr | Dec 2025 | 0.02 ac | $174,300 | $161,000 | -7.6% |
| 65 | 877 Grandview Ave | Dec 2025 | 0.2 ac | $273,300 | $255,000 | -6.7% |
| 66 | 40 Bon Accord Dr | Dec 2025 | 0.1 ac | $233,100 | $340,000 | +45.9% |
| 67 | 12 Silverstone St | Nov 2025 | 0.4 ac | $197,400 | $245,000 | +24.1% |
| 68 | 84 Josselyn Rd | Nov 2025 | 0.3 ac | $292,900 | $337,500 | +15.2% |
| 69 | 181 Garnett Rd | Nov 2025 | 1.2 ac | $226,500 | $315,000 | +39.1% |
| 70 | 19 Lakefield Crt | Nov 2025 | 0.3 ac | $448,000 | $490,000 | +9.4% |
| 71 | 14 Colter St | Nov 2025 | 0.1 ac | $307,000 | $335,000 | +9.1% |
| 72 | 233 Mark Dr | Nov 2025 | 0.1 ac | $239,300 | $275,000 | +14.9% |
| 73 | 412 Highmeadow Dr | Nov 2025 | 0.02 ac | $192,200 | $191,000 | -0.6% |
| 74 | 4 York St | Nov 2025 | 0.2 ac | $408,800 | $385,000 | -5.8% |
| 75 | 40 Creighton Ave | Nov 2025 | 0.2 ac | $222,500 | $220,000 | -1.1% |
| 76 | 19 Bermuda Ct | Oct 2025 | 0.1 ac | $334,400 | $341,000 | +2.0% |
| 77 | 907 Highmeadow Dr | Oct 2025 | 0.02 ac | $198,200 | $195,000 | -1.6% |
| 78 | 585 Bonita Ave | Oct 2025 | 0.2 ac | $284,000 | $325,000 | +14.4% |
| 79 | 62 Robar Crt | Oct 2025 | 0.2 ac | $269,400 | $325,000 | +20.6% |
| 80 | 69 Old Lake Trail | Oct 2025 | 0.2 ac | $361,000 | $469,874 | +30.2% |
| 81 | 10 Swanton St | Oct 2025 | 0.2 ac | $245,500 | $320,000 | +30.3% |
| 82 | 228 Boyaner Cres | Oct 2025 | 0.08 ac | $205,500 | $292,500 | +42.3% |
| 83 | 10 Lakefield Crt | Oct 2025 | 0.1 ac | $399,300 | $410,000 | +2.7% |
| 84 | 169 Champlain Dr | Oct 2025 | 0.2 ac | $278,000 | $360,000 | +29.5% |
| 85 | 3 Old Lake Trail | Oct 2025 | 0.2 ac | $421,300 | $450,000 | +6.8% |
| 86 | 3 Falcon Cres | Oct 2025 | 0.2 ac | $391,600 | $400,000 | +2.1% |
| 87 | 144 Cottage Rd | Oct 2025 | 0.7 ac | $223,900 | $190,000 | -15.1% |
| 88 | 33-35 Strathorne Ave | Oct 2025 | 0.2 ac | $339,200 | $200,000 | -41.0% |
| 89 | 47 Boyaner Cres | Oct 2025 | 0.06 ac | $209,100 | $320,000 | +53.0% |
| 90 | 270 Mark Dr | Oct 2025 | 0.2 ac | $360,900 | $416,000 | +15.3% |
Public record: the price registered with the province when each home changed hands, about a month behind the registry, with the province’s assessed value at the time and the lot measured from the parcel’s own outline. A transfer far from the assessed value, such as one between family, is left out, so these are the same sales the figures above count.
Every street inside the line with its homes, and how many of them changed hands since October 2025.
The mobile homes inside the line, most of them in its two parks.
$128,500
Median sale price, the last twelve months
+31.1%
Median sale against assessed value
| Number on the map | Address | Month | Lot | Assessed | Sold for | vs assessed |
|---|---|---|---|---|---|---|
| 1 | 8 Fall Dr | Sep 2026 | 0.05 ac | $73,100 | $140,000 | +91.5% |
| 2 | 69 Susan Dr | Aug 2026 | 0.02 ac | $198,800 | $234,000 | +17.7% |
| 3 | 9 Gull St | Aug 2026 | 0.02 ac | $40,700 | $55,000 | +35.1% |
| 4 | 11 Kingfisher Rd | Jul 2026 | 0.02 ac | $41,500 | $146,000 | +251.8% |
| 5 | 43 Susan Dr | Jun 2026 | 0.02 ac | $173,900 | $199,900 | +15.0% |
| 6 | 23 Susan Drive | Apr 2026 | 0.02 ac | $81,000 | $180,000 | +122.2% |
| 7 | 19 Gull St | Mar 2026 | 0.02 ac | $42,100 | $60,000 | +42.5% |
| 8 | 6 Gull St | Mar 2026 | 0.02 ac | $45,200 | $100,000 | +121.2% |
| 9 | 9 Quail Crt | Mar 2026 | 0.02 ac | $96,400 | $136,000 | +41.1% |
| 10 | 10 Nouwens Dr | Mar 2026 | 0.02 ac | $64,400 | $102,000 | +58.4% |
| 11 | 16 Starling St | Feb 2026 | 0.02 ac | $24,100 | $15,000 | -37.8% |
| 12 | 9 Sandpiper Rd | Jan 2026 | 0.02 ac | $75,500 | $80,000 | +6.0% |
| 13 | 14 Wren St | Jan 2026 | 0.02 ac | $87,600 | $90,000 | +2.7% |
| 14 | 25 Swallow St | Jan 2026 | 0.02 ac | $51,200 | $100,000 | +95.3% |
| 15 | 28 Morland Ave | Dec 2025 | 0.02 ac | $82,700 | $105,000 | +27.0% |
| 16 | 19 Crane Crt | Dec 2025 | 0.02 ac | $204,400 | $205,000 | +0.3% |
| 17 | 13 Susan Dr | Nov 2025 | 0.02 ac | $169,000 | $208,520 | +23.4% |
| 18 | 5 Dove St | Oct 2025 | 0.02 ac | $65,000 | $140,000 | +115.4% |
| 19 | 17 Sandpiper Rd | Oct 2025 | 0.02 ac | $199,600 | $236,464 | +18.5% |
| 20 | 9 Heron St | Oct 2025 | 0.02 ac | $199,600 | $231,946 | +16.2% |
| 21 | 10 Sandpiper Rd | Oct 2025 | 0.02 ac | $87,700 | $121,000 | +38.0% |
| 22 | 1 Dove St | Oct 2025 | 0.02 ac | $26,100 | $18,000 | -31.0% |
Public record: the price registered with the province when each mobile home changed hands, about a month behind the registry, with the province’s assessed value at the time and the lot measured from the parcel’s own outline. A transfer far from the assessed value, such as one between family, is left out, so these are the same sales the figures above count.
Every street inside the line with its mobile homes, and how many of them changed hands since October 2025.
The wider picture
111
Homes for sale in Saint John now
$369,900
Median asking price for a Saint John home
$333,750
Median sale price across Saint John and area, every property type, September 2026: 186 sales
For your own home
Pick your home. Each month you get what sold in the neighbourhood, house by house, what is listed inside the line, and the picture around your own home. Nothing is valued and nothing is sold. One click stops it.
The search knows only Saint John East’s streets, so start with your house number.
1. Find your home
Grace Chappel, for Saint John East
REALTOR® · The Ellis Team at REAL Brokerage
Questions about your own home? Call or text.